
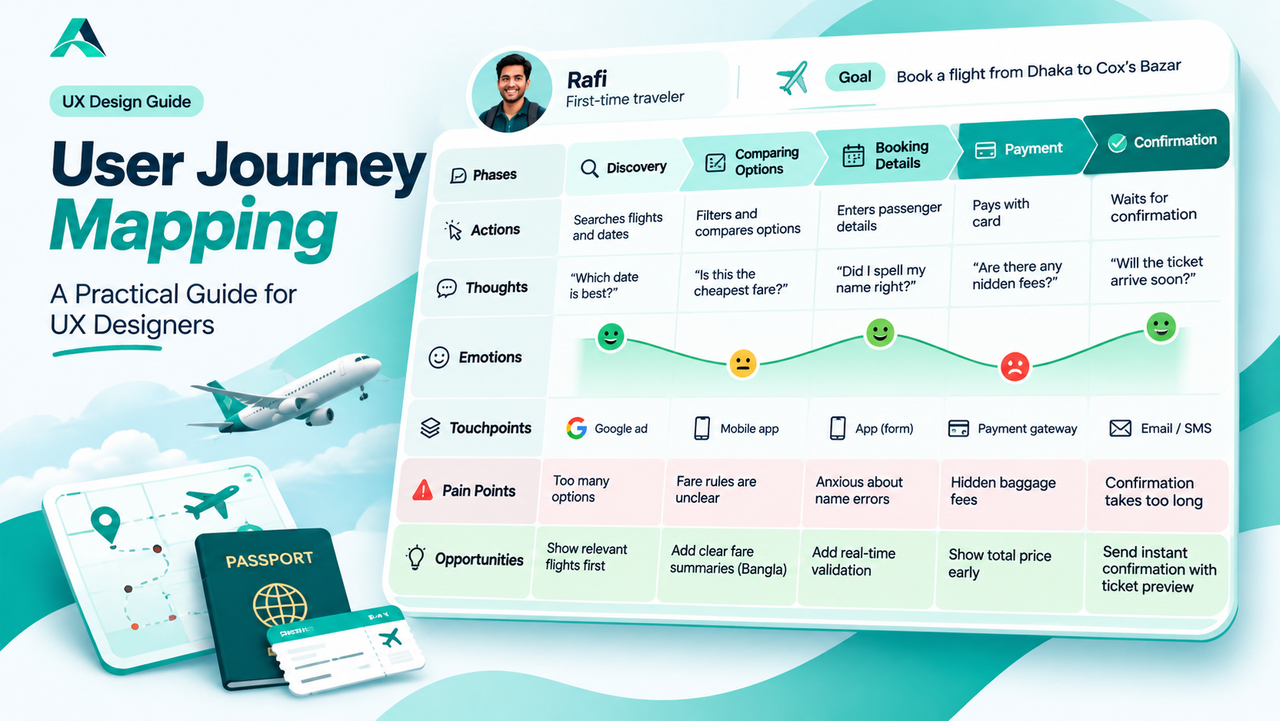
User journey mapping follows one person through an entire experience, from the first thought of a problem to the feeling they are left with. Here is how to build a journey map, what to put on it, and how to turn it into design decisions.
In short: User journey mapping lays out what a person does, thinks, and feels at every step of an experience, so the team can see pain points and opportunities instead of guessing about them.
Why Screens Alone Miss the Story
When you open your Figma file, you see frames. When a user opens your product, they see a story. They start with a problem, wander through discovery, weigh options, hesitate at the payment step, and carry a feeling about your product long after the screen is closed.
Designing screens one by one is like writing sentences without reading the paragraph. Each screen can be perfectly usable while the overall experience is a mess: a booking flow with clean screens but a total price that only appears at the end, a signup with friendly forms but a confirmation email that never arrives. No single frame shows these problems, because they live between the frames, in the transitions, the waiting, and the emotions.
That is what a journey map captures. It puts the user, not the interface, at the center, and it tells their story across time. For designers who want to move from executing screens to shaping products, it is one of the most useful tools there is.
What Is User Journey Mapping?
A user journey map is a visual story of one person's experience with a product or service, drawn along a timeline. Nielsen Norman Group describes journey maps as combining two powerful instruments, storytelling and visualization, in order to help teams understand and address customer needs.
Every good map has the same basic ingredients. It starts with a lens: one persona (who the map is about) and one scenario (what they are trying to achieve). It then follows that person through chunkable phases of the journey. For each phase, it records the heart of the experience: what the person does, what they think, and how they feel. It marks the touchpoints where the person interacts with the company, and the channels those interactions travel through, such as the website, the mobile app, email, or a phone call. Finally, it ends with the output that justifies the whole exercise: the insights and pain points discovered, the opportunities to improve, and the owners responsible for each part.
As UX writer Paul Boag puts it: "Data often fails to communicate the frustrations and experiences of customers. A story can do that, and one of the best storytelling tools in business is the customer journey map." Analytics can tell you that users abandon the checkout at 40 percent. The journey map tells you why: they were anxious about hidden fees, confused by the fare rules, and left waiting for a confirmation that came too late.
One important distinction: a user journey map is not a user flow diagram. A user flow shows the paths through screens in your product. A journey map shows the experience, including everything that happens off screen, the worry before paying, the comparison spreadsheet, the call to customer support. User flows answer "how do they get through the interface?" Journey maps answer "how does the whole experience feel?"
The Anatomy of a Journey Map
Most journey maps are built as a grid. The columns are the phases of the journey, and the rows are the lenses through which you read each phase. Here is what each row holds, with an example from a realistic scenario: Rafi, a first-time traveler booking a flight from Dhaka to Cox's Bazar on a travel app.
| Lane | What goes there | Example: Rafi books a flight |
|---|---|---|
| Phases | The big stages of the story, in order | Discovery → Comparing options → Booking details → Payment → Waiting for confirmation |
| Actions | What the person actually does | Searches dates, filters results, types passenger names, enters card details, refreshes his email |
| Thoughts | Questions and doubts in their head | "Is this the cheapest fare?" "Did I spell my name right?" "Will the ticket actually arrive?" |
| Emotions | A curve of how they feel, phase by phase | Excited → cautious → focused → anxious → relieved or frustrated |
| Touchpoints and channels | Where they meet your company | Google ad, mobile app, payment gateway, confirmation email, SMS |
| Pain points | Where the experience breaks or frustrates | Hidden baggage fees at payment; no fare rules in Bangla; confirmation takes 20 minutes |
| Opportunities | Design moves each pain point suggests | Show total price early; add Bangla fare summaries; send instant confirmation with a ticket preview |
The rows work together. The emotion curve tells you where to look. The thoughts explain why the curve dips. The touchpoints show which part of the company owns the problem. And the opportunities row turns the whole thing from a diagnosis into a plan.
Building Your First Journey Map in Five Steps
1. Define the goal and scope. Start with the business goal the map will support, such as reducing booking abandonment or improving first-time activation. Then fix the scope: one persona, one scenario, one clear start and end. Also decide whether you are mapping the current state, to diagnose today's experience, or a future state, to design the experience you want. Mixing the two produces confusion, so label your choice on the map itself.
2. Do the research. This is the step that separates real maps from fiction. Gather qualitative evidence: user interviews, session recordings, support tickets, app store reviews, diary studies. Quantitative data is welcome too; it can validate what the research shows or convince skeptical stakeholders. But numbers alone cannot write a story. If a cell in your map is filled from memory or guessing, mark it honestly, for example with a dotted border, so the team knows what still needs research.
3. Sketch the phases and touchpoints. Lay out the columns for each phase of the scenario, from the moment before the user opens your product to the moment after they close it. Then list every touchpoint and channel the persona meets along the way. This step often surprises teams: the journey usually starts earlier and involves more channels than anyone assumed.
4. Fill in what the user does, thinks, and feels. Work through each phase and add the actions, the thoughts and questions, and the emotional state. The emotion curve is the map's engine. Mark the moments of truth, the few make-or-break instants where the experience either earns trust or loses it. For Rafi, the payment step and the wait for confirmation are the moments of truth. Everything else is context around them.
5. Find the pain points, then share the map and assign owners. Turn the dips in the emotion curve into named pain points, write the opportunity each one suggests, and assign an owner to every item. Then make the map visible: discuss it in meetings, pin it where decisions are made, and revisit it as the design changes. A map that lives only in a PDF is decoration. A map that the team argues over is a tool.
Remember: a journey map built on assumptions is fiction, not research. Base the narrative on truth first, qualitative research, then support it with data, and never let the desire for a pretty diagram rush you past the evidence.
Common Mistakes
Mapping from assumptions. The most expensive mistake is also the most common. Teams spend a workshop drawing what they believe users feel, then design with false confidence. Research is not a phase you can skip; it is the material the map is made of.
One map, three personas. A map that tries to represent every user represents none. The story gets vague, the pain points blur, and the opportunities fit nobody. Keep one map per persona, or at least per distinct goal.
Treating the diagram as the deliverable. Emailing a finished map and moving on wastes the work. The map's value is in the shared understanding it builds and the decisions it keeps influencing. If nobody references it in the next sprint planning, it failed, however beautiful it looks.
Jumping straight to screens. A journey map should change what you design, not just decorate the process. If the team sketches solutions before the insights are synthesized and agreed on, the map was theater. Synthesis first, screens after.
Confusing current-state with future-state maps. A current-state map diagnoses today's experience from research. A future-state map imagines the redesigned experience. Both are useful, but they answer different questions. Label yours, or readers will read a diagnosis as a promise.
When a touchpoint reveals users overwhelmed by too many options, resist the urge to add more features. Often the fix is simpler choices and clearer next steps, the territory of Hick's Law: Why Fewer Choices Help Users Decide Faster.
FAQs
Is a user journey map the same as a user flow or a service blueprint?
No, though they are related. A user flow maps the screen-to-screen paths inside your product. A journey map maps the whole experience, including thoughts, feelings, and off-screen moments. A service blueprint goes one layer deeper: it adds the behind-the-scenes processes and systems that support each touchpoint. Use journey maps when you need empathy and story; add a blueprint when you need operational detail.
How detailed should a journey map be?
Detailed enough to tell a complete, truthful story, and no more. Nielsen Norman Group suggests asking what level of detail is needed to tell the story, and letting the business goal decide the tradeoffs between breadth and depth. A map for redesigning checkout can zoom into five minutes of activity. A map for understanding loyalty can span a year.
Can you map a journey for a product that does not exist yet?
Yes. Future-state maps are a legitimate use: you map the experience you intend to design, then test it with prototypes and research before building. Just label it clearly as a future-state map so nobody mistakes the vision for the current reality.
Who should be involved in making the map?
More people than you think. Journey mapping is a collaborative exercise: researchers bring the evidence, designers bring the visualization, product managers bring the business goals, and support and sales teams bring the stories they hear every day. Stakeholders who help build the map become its champions.
Key Takeaways
- ✓ A journey map tells one person's story across time: what they do, think, and feel at every touchpoint.
- ✓ The emotional curve is the map's engine. Pain points live where the curve dips.
- ✓ Research first, diagram second. Maps built on assumptions are fiction.
- ✓ Every insight and opportunity needs a named owner, or nothing changes.
- ✓ Keep the map alive: discuss it in meetings and update it as the experience changes.
Conclusion
Screens are how designers work. Stories are how users live. A user journey map bridges the two: it takes the research you have, the analytics you trust, and the instincts you cannot quite explain, and turns them into one shared story the whole team can act on. That is the quiet power of user journey mapping.
Start small. Take one persona, one scenario, and five phases, and map an experience you already know well. Fill the do, think, and feel rows honestly, mark the cells you are guessing at, and watch the moments of truth appear. You will find design opportunities that no analytics dashboard and no single screen ever showed you, because they were hiding in the one place you had not looked: the journey between the screens.
References and Further Reading
- Customer Journey Maps: When and How to Create Them, Nielsen Norman Group
- Customer Journey Map: Definition and Process, Interaction Design Foundation

Written by
Md Arshak Hossain Zahid
UI/UX Designer · Founder of ArshakUIX
Practical insights on UX laws, usability, design systems, and product design.